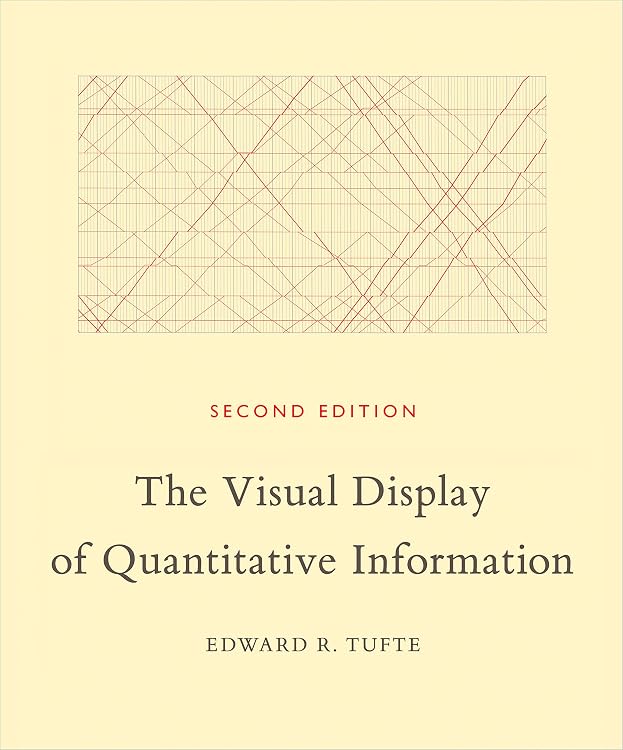
The Visual Display of Quantitative Information, 2nd Edition
The Visual Display of Quantitative Information is Edward Tufte’s book on the design and interpretation of statistical graphics. This second edition covers chart and table design, graphical deception, data-ink, small multiples and time-series, with 250 illustrations and colour reproductions among its stated changes.
At a glance
- Addresses statistical graphics, charts and tables through design theory and practical examples.
- The listing describes 250 illustrations, including examples discussed as effective or poor graphics.
- Topics include data-ink, small multiples, time-series, relational graphics, data maps and multivariate designs.
- This edition is described as adding colour reproductions of William Playfair’s graphics and incorporating changes and corrections to the first edition.
Often bought together

Pros and cons
Pros
- Covers both graphic design principles and ways to detect misleading visual presentation.
- Its range of topics can support readers working with different forms of quantitative data.
- Customer feedback describes the writing as careful and the book as informative.
Cons
- At 200 pages and a listed weight of 953 g, this is a substantial print reference rather than a compact, lightweight read.
Technical specifications
9 specifications| Publisher | Graphics Press |
|---|---|
| Edition | 2nd |
| Publication date | 14 February 2001 |
| Language | English |
| Print length | 200 pages |
| Weight listed | 953 g |
|---|---|
| Dimensions | 27.94 x 22.86 x 2.54 cm |
| ISBN-10 | 9780961392147 |
|---|---|
| ISBN-13 | 978-0961392147 |
Who is it for?
A good fit for
- Readers studying statistics, data visualisation or information design.
- Analysts and writers who want to assess chart clarity and recognise graphical deception.
- Readers interested in the history and design of statistical graphics.
Less suited to
- Readers seeking a current software tutorial or step-by-step instruction for a particular charting tool.
Customer reviews on Amazon
- 5 stars
81% 81% - 4 stars
11% 11% - 3 stars
4% 4% - 2 stars
2% 2% - 1 star
2% 2%
Customer feedback describes the book as an essential, informative overview, with praise for its careful writing and value. Some customers also mention its treatment of graph history. Reactions to the graphics are mixed, with some describing them negatively. That matters because the book relies on illustrations to discuss visual design, even though the listing states that this edition includes colour reproductions.
Positive themes
- Customers praise the informative content and careful writing.
- Some customer feedback highlights the book’s discussion of graph history and perceived value.
Mixed feedback
- Customer reactions to the graphics are mixed, including some negative descriptions.
Frequently asked questions
What subjects does this book cover?
The listing describes coverage of statistical graphics, charts and tables, including data-ink, small multiples, time-series, maps, multivariate designs and graphical deception.
What is distinctive about the second edition?
The listing says it includes colour reproductions of many William Playfair graphics, adds colour to other images and incorporates changes and corrections accumulated during 17 printings of the first edition.
Is this a practical guide or a theoretical book?
The listing describes both theory and practice, with detailed analysis of displaying data for precise, effective and quick analysis.
Alternative options

Multiply Your Wealth by Investing in Stocks: A beginner's guide investing in the stock market.
$0.99
The Fallacy Detective: Thirty-Eight Lessons on How to Recognize Bad Reasoning
$14.55

Logic Workbook for Gritty Kids: Spatial reasoning, math puzzles, word games, logic problems, activities, two-player games. (The Gritty Little Lamb ... & STEM skills in kids ages 6, 7, 8, 9, 10.)
$14.09

Investment mistakes that keep us from success: Avoid them to win in the stock market
$9.99
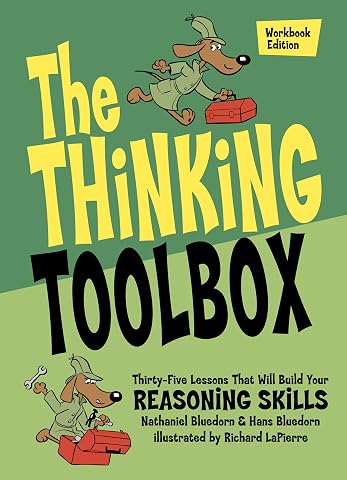
The Thinking Toolbox: Thirty-Five Lessons That Will Build Your Reasoning Skills
$14.75
Systems Thinking for Beginners: Learn the essential systems thinking skills to navigate an increasingly complex world for effective problem solving and decision making
$3.99

An Intermediate Logic Workbook for Gritty Kids: Spatial Reasoning, Math Puzzles, Word Games, Logic Problems, Focus Activities, Two-Player Games. ... & STEM Skills in Kids Ages 8, 9, 10.)
$14.09
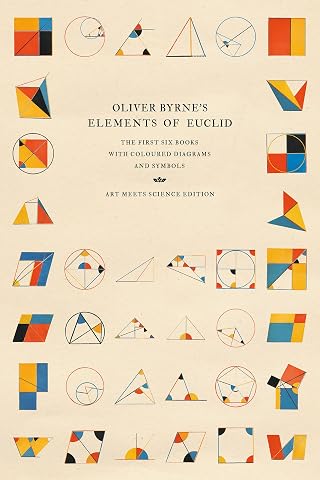
Oliver Byrne's Elements of Euclid: The First Six Books with Coloured Diagrams and Symbols
$72.72
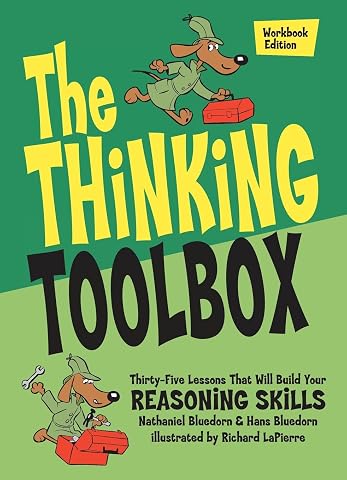
The Thinking Toolbox: Thirty-Five Lessons That Will Build Your Reasoning Skills
$51.99
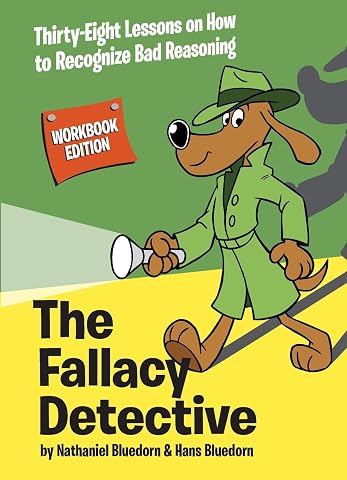
The Fallacy Detective: Thirty-Eight Lessons on How to Recognize Bad Reasoning
$47.99
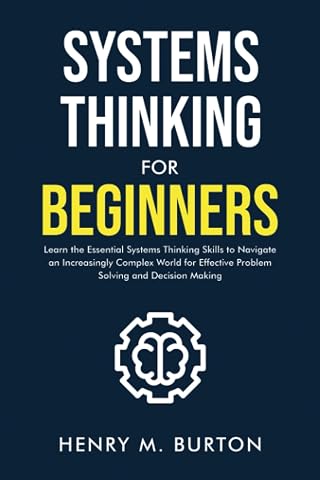
Systems Thinking for Beginners: Learn the essential systems thinking skills to navigate an increasingly complex world for effective problem solving and decision making
$14.99