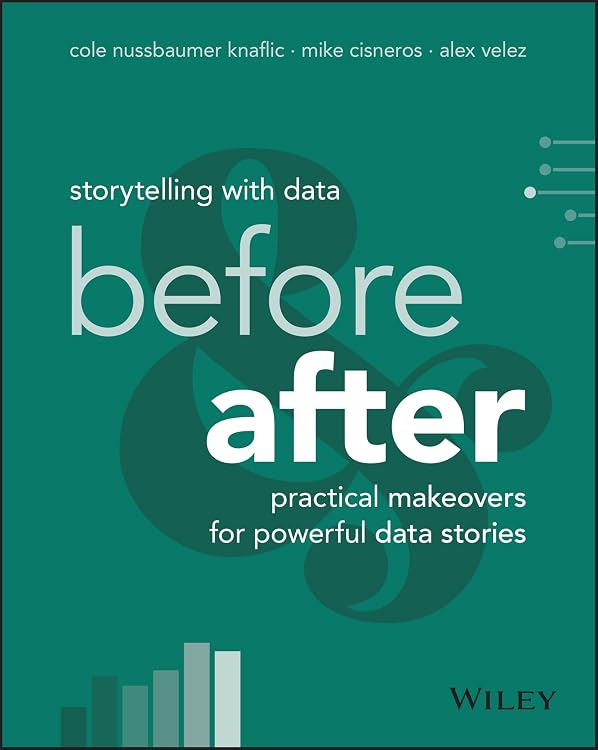
Storytelling with Data: Before and After — Practical Data Story Makeovers
Storytelling with Data: Before and After is a practical guide to improving data visuals and shaping them into clear stories. It uses twenty before-and-after makeovers to explain changes such as simplifying charts, removing clutter and directing attention to key insights.
At a glance
- Twenty before-and-after makeovers show how charts can be redesigned, with the reasoning behind each change.
- Covers story structure, visual clarity, colour, layout and directing attention to important insights.
- Addresses challenges including time constraints and poorly designed templates.
- The listing presents the guidance as applicable across roles and experience levels.
Reference price: $65.95
Price checked: 13 Nov 2026
View offerAhead of Black FridayExplore the selectionOften bought together
Pros and cons
Pros
- The makeover format links visual changes to the thinking behind them, giving readers concrete examples to study.
- The subjects extend beyond chart appearance to narrative structure and communication with an audience.
- Customer feedback describes the material as practical and engaging.
Technical specifications
9 specifications| Publisher | Wiley |
|---|---|
| Publication date | 4 October 2025 |
| Edition | 1st |
| Language | English |
| Print length | 432 pages |
| ISBN-10 | 1394289618 |
| ISBN-13 | 978-1394289615 |
| Weight listed | 868 g |
|---|---|
| Dimensions | 18.54 x 2.54 x 23.11 cm |
Who is it for?
A good fit for
- Readers who want worked examples of data visualisation redesign.
- Professionals preparing data-focused slides or business communications.
- Readers looking for guidance on turning charts into audience-focused narratives.
Customer reviews on Amazon
- 5 stars
89% 89% - 4 stars
9% 9% - 3 stars
0% 0% - 2 stars
0% 0% - 1 star
2% 2%
Customer feedback highlights practical, insightful content and an engaging presentation, including the value of the twenty data makeovers. That emphasis fits the book’s example-led format for readers learning to clarify charts and build data stories. The supplied rating distribution is strongly positive overall, though ratings alone do not establish why readers responded as they did.
Positive themes
- Customers describe the content as insightful and practical.
- Feedback highlights the makeover examples and an engaging reading experience.
Frequently asked questions
What does the book cover?
It presents twenty before-and-after data makeovers and explains approaches to story structure, visual design, colour, layout and focusing attention on key insights.
Does it include practical examples?
Yes. The listing describes twenty makeovers of ineffective charts into more engaging visuals, with the reasoning behind each redesign.
Who is the book aimed at?
The listing says its lessons are intended for readers across roles, experience levels and comfort with data.
Alternative options
Storytelling with You: Plan, Create, and Deliver a Stellar Presentation
$53.24
The Big Book of Dashboards: Visualizing Your Data Using Real-World Business Scenarios
$55.81
Dashboards That Deliver: How to Design, Develop, and Deploy Dashboards That Work
$32.20
Think in Systems: The Art of Strategic Planning, Effective Problem Solving, And Lasting Results: 1
$25.60